A Model for Predicting Performance in Race Across America
June 11, 2015/ Jim Parker
RAAM 2015 is coming up and I have to admit I am excited. This is a very fun event to follow from a comfortable distance, especially if you like cycling and playing with numbers.
The advent of GPS-satellites, power meters, and software that tracks the speed, position, and elevation of a cyclist has opened a new world of analytic possibilities. A single training ride can produce reams of data. It is possible to breakdown every race course into small bits and calculate the grade of every one of those bits, and then, if you know the speed the cyclist will ride at all the various grades, you can make a very accurate prediction of that racers overall time on that particular course. I have done those calculations for a few courses, but the process is very laborious, based on up to 25,000 grade calculations for a single course. Here I propose a much simpler and equally accurate means of predicting performance based on only a handful of parameters that most cyclists should be able to obtain.
First we need to know only a few parameters for the course: 1) distance 2) total elevation gain and 3) total elevation loss. For a long race, like RAAM, RAW, or the Texas Tejas 500, you should have these parameters for each time station, or, as for the loop course of the Tejas 500, a single lap. For example, the distance from the start of RAAM in Oceanside, CA to the first time station at Lake Henshaw is 56.8 miles with 5,897 feet of elevation gain and 3,144 feet of elevation loss. These numbers are often published on the race organizers’ website, or you can find them on websites like RidewithGPS.com.
Next, we need only five parameters for the racer: VAM, FAS, DS-5, PDF, and Stop-time.
VAM = Velocity of Ascent, Meter/hour. In Italian, the native tongue of Michele Ferrari who developed the concept of VAM, the term is: Velocita Ascensionale Media. This is the pure vertical component of your speed, as if you were in an elevator. The units are meters of elevation gain per hour. If you have a Garmin or other recording device on your bike, it’s probably already calculating your VAM. You can get a very close estimate of your VAM by taking your threshold power to weight ratio and multiplying that by 300. Threshold power is the maximum power you can sustain for an hour, in Watts. Your weight is the combined weight of the rider and bike, in kg. For example, my combined weight is 210 lbs (95.5 kg) and my threshold power is 240 W. Thus 300 x 240 / 95.5 = 754 VAM. If I lost 10 lbs. my VAM would be 792! Professional cyclists have VAMs of 1200 to 2000.
FAS = Flat Average Speed. This is your top 1-hour sustainable speed on a flat course on a windless day. The units in this model are miles per hour. The major determinant of this parameter is your power to aerodynamic drag ratio (Cd*A).
DS-5 = Descending Speed, 5% grade. This is your average speed traveling down a 5% grade, in mph. Major determinants of this parameter are your aerodynamics (that’s why you see some pros sit on their top tube during descents) and your descending skill/guts. You can have the fastest aerodynamic profile in the race, but if you ride your brakes on the downhills, you DS-5 will be slow.
PDF = Performance Decay Factor. This is the percent of your original speed when you were fresh at the beginning of the race, compared to your speed at the end. For example, if your FAS is 20 mph, but you will be doing 15 mph on the flats at the last time station, your PDF would be 75%. The major determinants of PDF are the length of the race, your level of endurance training, nutrition/hydration, and ergonomics. For a super-long race like RAAM, a PDF of 65% is typical. For a 50-100 mile race, the PDF might be 90%.
Stop-time = the time the bike is not moving, in hours, for whatever reason (rest, traffic, mechanical, etc.)
Now for the good news. You don’t have to know ANY of these five parameters if you have some reliable racing data. If you’ve done a long race with significant elevation changes and have your lap or time-station results, you can use this model to calculate the four parameters.
For example, let’s look at Christoph Strasser’s record-setting 2014 performance in RAAM (an amazing 7 days, 16 hours). His time to each of the 55 time stations is publicly available on the RAAM website. I manually adjusted each of the parameters to get the closest match between predictions based on the model, and his actual results at each time station. Here are the results for Strasser: VAM = 1010 m/hr, FAS = 23.6 mph, DS-5 = 38 mph, PDF = 65%, and stop-time of 13 hours.
For another example, let’s look at Rob White, who will be racing RAAM for the first time this year, raising money for 3000 Miles to a Cure. Based on his Tejas 500 results, and his RAW results, I calculate a VAM of 810, FAS of 20.5 mph, and DS-5 of 35 mph. If he takes 45 hours off the bike (much more than Strasser takes), and has a PDF of 65%, he will finish in a very respectable 10 days, 5 hours.
How does the model work?
The speed and distance of all climbing (elevation increase) is calculated as if all climbing were performed on a single ramp at a constant 5% grade. The speed and distance of all descending is also calculated for a constant 5% grade. The remaining distance in the race is calculated as perfectly flat. The performance decay factor is applied linearly across however many time-stations or laps are listed for the race. If all of the climbing in RAAM was done on one 5% ramp, the ramp would be 494 miles long! There would be 494 miles of 5% downhill, and 2016 miles of flat.
Here is the model pre-loaded with data for the 2015 RAAM course, and parameters for Rob White. Column Q lists his predicted arrival time at each time station. Of course, these are only estimates. Variables such as weather/wind, traffic, and periodic rest stops of varying duration may significantly change his actual arrival time. If you like to play with numbers, you can adjust each of the parameters and see what happens to the time predictions. For this RAAM model, the stop-time is divided evenly among the time stations except for the first three, since most racers don’t stop, or stop only briefly, before reaching Arizona.
We will be using this model to help plan supprt for Rob White, and we used an earlier version of this model to plan and predict Maria’s time station arrivals in RAAM 2013. The 2015 race starts on June 16th.
If you’d like to follow Rob’s progress this year, sign up for email updates at 3000milestoacure.com. Rob is riding a standard DF bike, but there is a very good chance that an intrepid racer will be riding a Cruzbike in RAAM 2016, so stay tuned.
{Maria Parker at the RAAM 2013 start, followed by her ill-fated support vehicle}
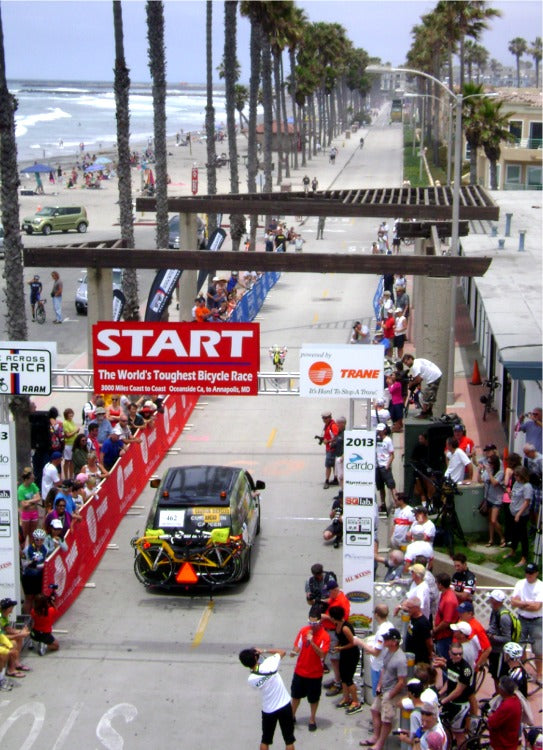
photo credit: Peter Sword
Leave a comment